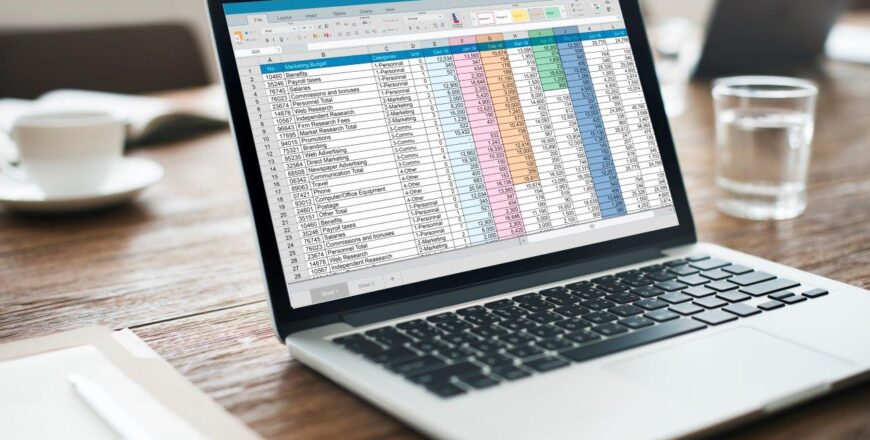
Microsoft Excel is a powerful spreadsheet program that is widely used for data analysis, organizing information, and performing calculations. Here are some basic concepts and features of Excel that beginners should be familiar with:
- Workbook: An Excel file is called a workbook. It contains one or more worksheets where you can input and manipulate data. By default, a new workbook opens with three worksheets labeled Sheet1, Sheet2, and Sheet3.
- Worksheet: A worksheet is a grid made up of cells arranged in rows and columns. Each cell can contain text, numbers, formulas, or functions.
- Cell: A cell is the intersection of a row and a column in a worksheet. Each cell is identified by a unique cell reference, which is a combination of the column letter and row number (e.g., A1, B2).
- Entering Data: You can enter data directly into cells by selecting a cell and typing. You can input text, numbers, dates, and formulas.
- Formatting: Excel offers various formatting options to enhance the appearance of your data. You can change font styles, apply colors, adjust cell borders, and format numbers as currency, percentage, or date formats.
- Formulas: Formulas are used to perform calculations in Excel. They begin with an equal sign (=) followed by mathematical operators (+, -, *, /) and cell references or values. For example, “=A1+B1” adds the values in cells A1 and B1.
- Functions: Excel provides a wide range of built-in functions for performing specific calculations. Functions are predefined formulas that simplify complex calculations. Some commonly used functions include SUM, AVERAGE, MAX, MIN, and COUNT.
- AutoFill: AutoFill is a feature that allows you to quickly fill a series of cells with a pattern or sequence. You can click and drag the fill handle (a small square at the bottom-right corner of a selected cell) to automatically populate adjacent cells with a pattern.
- Sorting and Filtering: Excel allows you to sort data in ascending or descending order based on a specific column. You can also filter data to display only the rows that meet certain criteria.
- Charts and Graphs: Excel includes charting capabilities to visually represent data. You can create different types of charts, such as bar charts, pie charts, line charts, and more, to present your data in a visually appealing way.
These are just the basics of Microsoft Excel. As you become more comfortable with these concepts, you can explore more advanced features and functionalities to further enhance your data analysis and management skills. Join us as we dive into the excel platform::::;
